Executive Summary Dashboard: Overview
This article provides an overview of the graphs present in Secureworks® Taegis™ VDR’s executive dashboard and helps you interpret visible metrics.
Global Overview ⫘
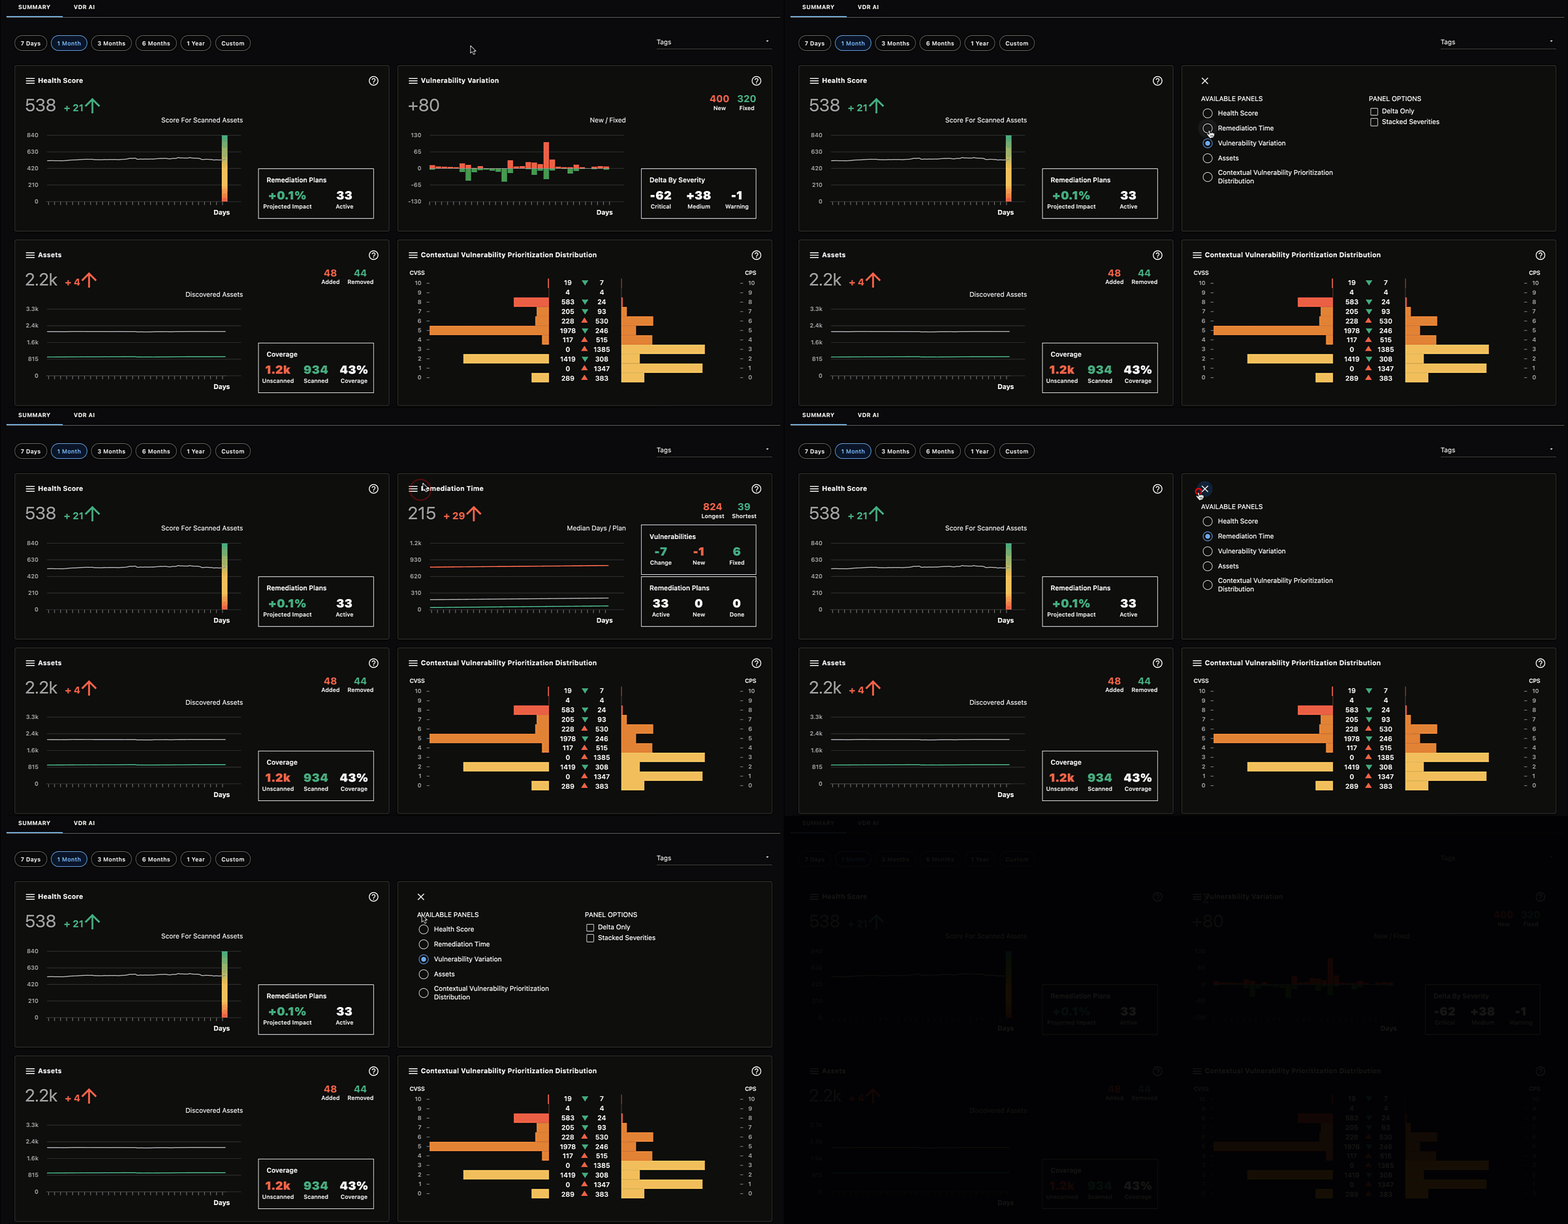
VDR’s executive summary dashboard is split in four sections that display panels representing multiple KPIs as they evolve over time.
Each panel can be viewed on a different time period by selecting a specific time frame in the upper left corner.
The displayed ticks in all the graphs' time axes represent a different period depending on the selected time frame as follows:
| Selected Timeframe | Period Represented |
|---|---|
| 7 Days | Each tick represents 1 day |
| 1 Month | Each tick represents 1 day |
| 3 Month | Each tick represents 1 week |
| 6 Month | Each tick represents 1 week |
| 1 Year | Each tick represents 1 month |
The data displayed in the dashboard is limited to the last year.
To alter which panel displays in each section of the dashboard, select the menu icon in the upper left corner of the desired section, choose the panel you would like displayed from the menu, and then select X to close the menu and view the updated panel.

Select a Dashboard Panel
Find documentation for each panel below:
- Health Score Panel
- Assets Panel
- Vulnerability Variation Panel
- Contextual Vulnerability Prioritization Panel
- Remediation Time Panel
