My Dashboards
My Dashboards is where you can create custom dashboards. Custom dashboards enable you to prioritize the data visualizations most relevant to you, through preconfigured widgets and a drag-and-drop interface. Custom dashboards are user specific, and each user can configure as many as they wish.
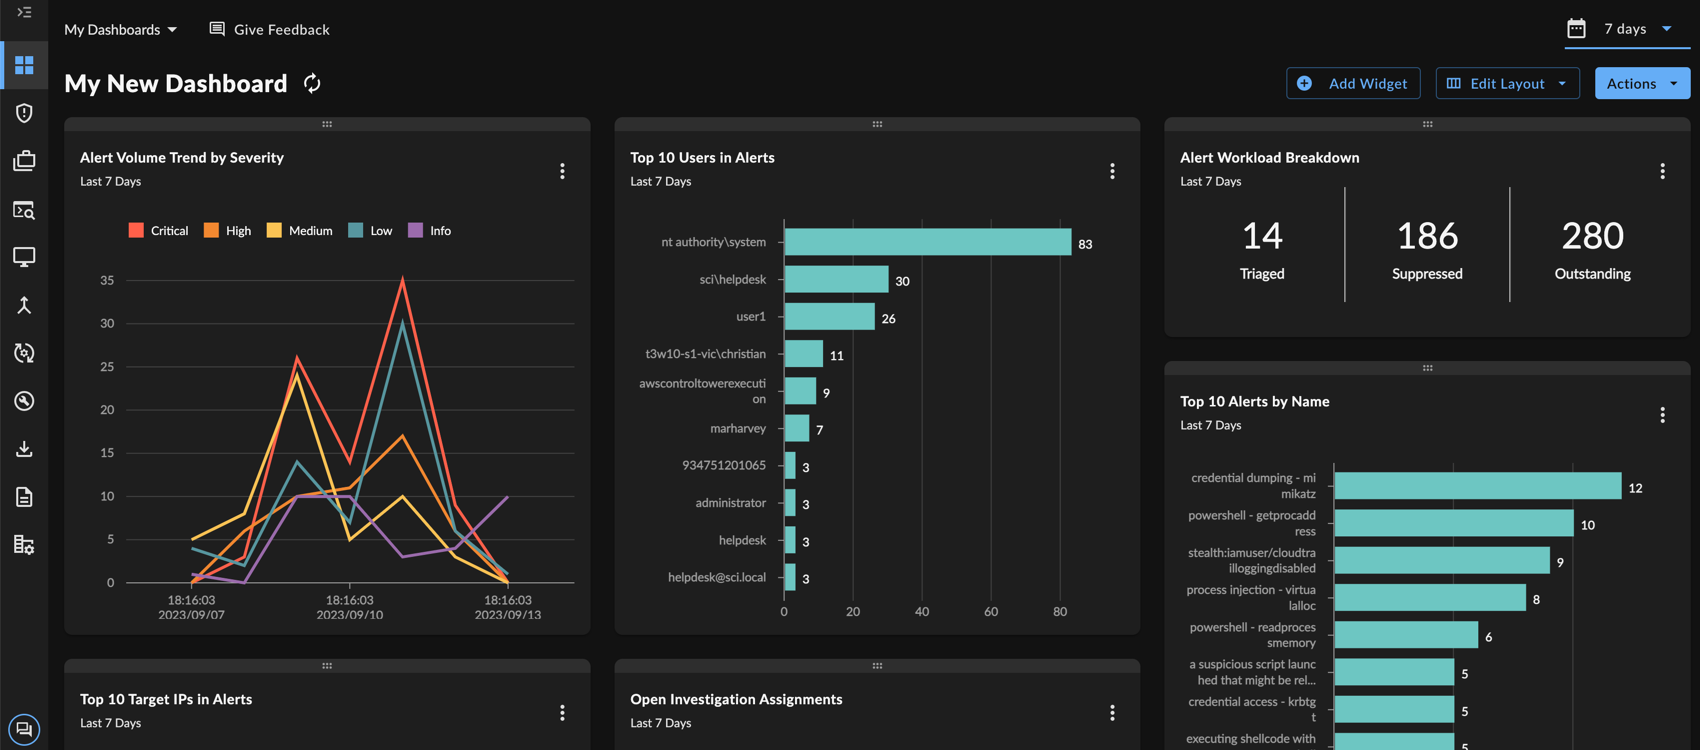
My Dashboards
Access My Dashboards ⫘
To access your custom dashboards, open the Dashboards menu from the side menu bar and select My Dashboards.
Each custom dashboard can be loaded from the My Dashboards drop-down menu at the top of the page.
Create a New Dashboard ⫘

Creating a New Custom Dashboard
To create a new custom dashboard:
-
Open the My Dashboards drop-down menu and select Create Dashboard.
-
The dashboard is created.
Select Add New Widget to start populating the dashboard with preconfigured widgets.
Tip
Copy an existing custom dashboard into a new one by selecting More Options > Duplicate Dashboard.
Available Widgets ⫘
The following preconfigured widgets are available for custom dashboards:
| Widget Name | Description | Purpose |
|---|---|---|
| Top 10 Source IPs in Alerts | Top 10 IP addresses that appear as the source of alerts. | Provides a sense of whether there is an egregious offender across all alerts. |
| Top 10 Target IPs in Alerts | Top 10 IP addresses that appear as the destination of alerts. | Helps identify the most commonly targeted assets across all alerts. |
| Top 10 Users in Alerts | Top 10 usernames that appear in alerts. | Indicates whether there is a more at-risk user in the environment. |
| Alert Workload Breakdown | Total number of alerts, broken down by those that have been triaged by analysts, suppressed by alert rules, and those that are open or ongoing. | Indicates the volume of alerts handled by security analysts vs. saved by Secureworks® Taegis™ XDR vs. awaiting review |
| Top 10 Alerts by Name | Top 10 alerts by title. | Provides insight on whether a common tactic has been leveraged across all alerts. |
| Alert Volume Trend by Severity | Total number of alerts created, grouped by severity. | Highlights the proportion of alert severities over time. |
| Alert Volume Trend over Time | Total number of alerts created. | Depicts increasing/decreasing trends in alert creation or abnormal spikes/deficits in alert activity. |
| Open Investigation Assignments | A list view indicating the quantity of open investigations for each assignee. | Highlights which users have investigations that need to be resolved. |
Expand a Widget ⫘
For supported widgets, open an expanded view that includes a table of the underlying alerts by selecting the widget title.

Expand a Widget
Customize a Dashboard ⫘
You can customize the following dashboard elements.

Customizing My Dashboard
Rename the Dashboard ⫘
Select the title of the dashboard to give it a new name.
Edit the Dashboard Layout ⫘
Select Edit Layout and choose your preferred layout view: One Column, Two Columns, or Three Columns.
Rearrange Widgets ⫘
Drag and drop widgets to rearrange them as needed.
Remove a Widget ⫘
Select the overflow menu icon ![]() and choose Delete Widget to remove it from your dashboard.
and choose Delete Widget to remove it from your dashboard.
Change Time Frame ⫘
Change the time frame of all widgets using the drop-down control at the top right of the dashboard. The default time period is the Last 7 Days, but choosing a custom time period overwrites it. The most recent time period selected becomes the new default.
Create One-Time Report ⫘

Creating a Report from a Custom Dashboard
You can take a snapshot of the current custom dashboard in a PDF report. To generate a one-time PDF report from a custom dashboard:
-
Customize the dashboard widgets as needed. All edits to the dashboard, including the name, date range, and order of the widgets are reflected in the report.
-
Select More Options > Create One-Time Report.
-
The report is generated. You will receive a notification when it is ready to download, or proceed to Reports in the left-hand navigation of XDR to watch its status.
-
When the report is ready to download, open the Actions icon
 and select Download PDF.
Delete a Custom Dashboard ⫘
To delete a custom dashboard:
-
Open the dashboard to display it.
-
Select More Options > Delete Dashboard.
-
Select Delete to confirm.
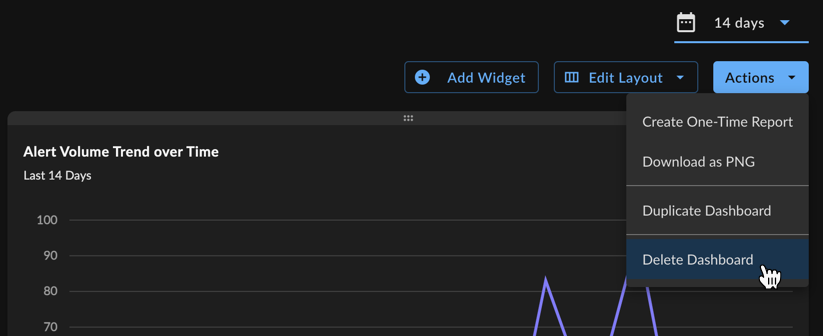
Delete Custom Dashboard
Export Options ⫘
Export Dashboard to PNG ⫘
To export the entire dashboard to a PNG image file, select Actions from the top right of the dashboard and choose Download as PNG. The file automatically downloads.
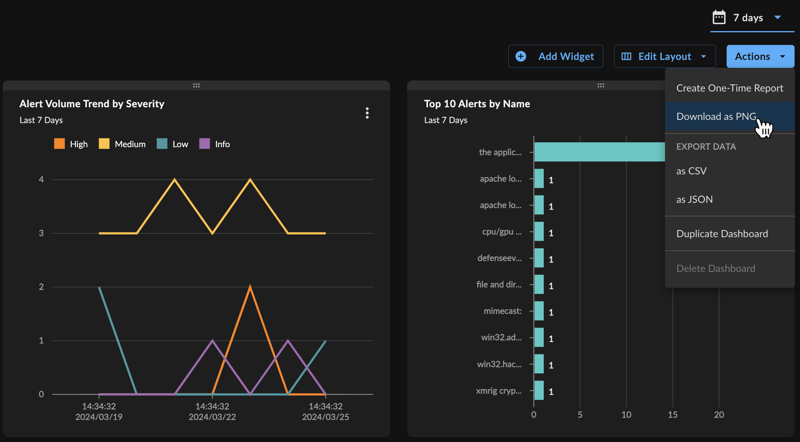
Export Dashboard to PNG
Export Dashboard Data ⫘
To export all data from the dashboard to a CSV or JSON file, select Actions from the top right of the dashboard and choose the Export Data CSV or JSON option.
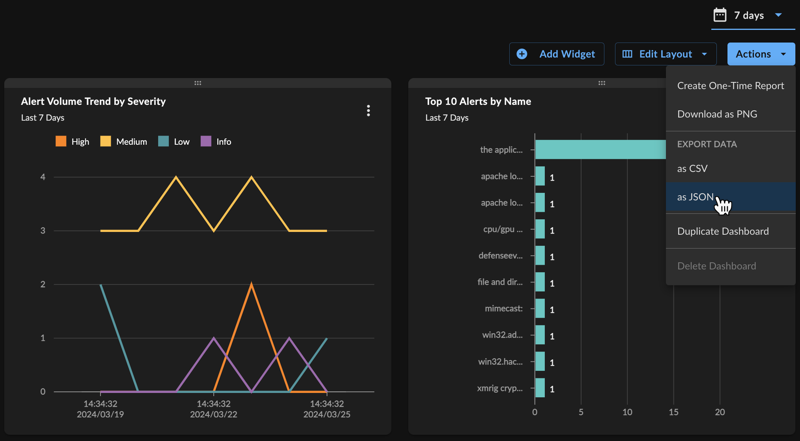
Export Dashboard Data
Export Widgets to PNG ⫘
To export an individual widget to a PNG image file, select the vertical ellipsis from the top right of the desired widget and choose Download as PNG. The file automatically downloads.
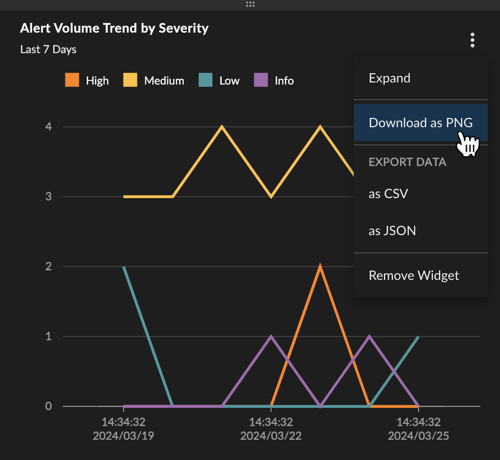
Export Widget to PNG
Tip
You can also export the visuals resulting from expanding certain widgets to PNG.
Export Widget Data ⫘
To export widget data as a CSV or JSON file, select the vertical ellipsis from the top right of the desired widget and choose the Export Data CSV or JSON option.
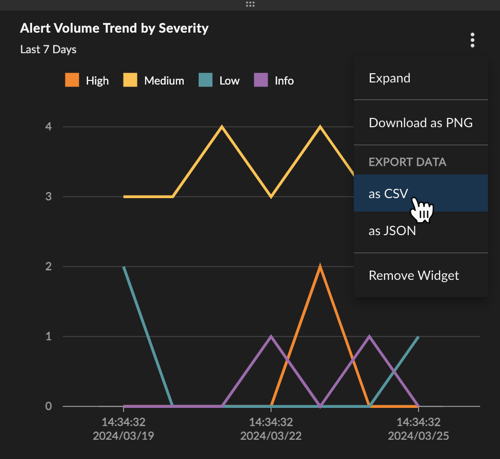
Export Widget Data
Tip
You can also export the data from visuals resulting from expanding certain widgets to CSV or JSON.
