Security Posture Dashboard
dashboards threat intelligence CTU countermeasures widgets
The Security Posture Dashboard highlights your organization’s security posture, as well as the security trends in your industry and others.
To access it, open the Dashboards left-side navigation menu and select Security Posture.
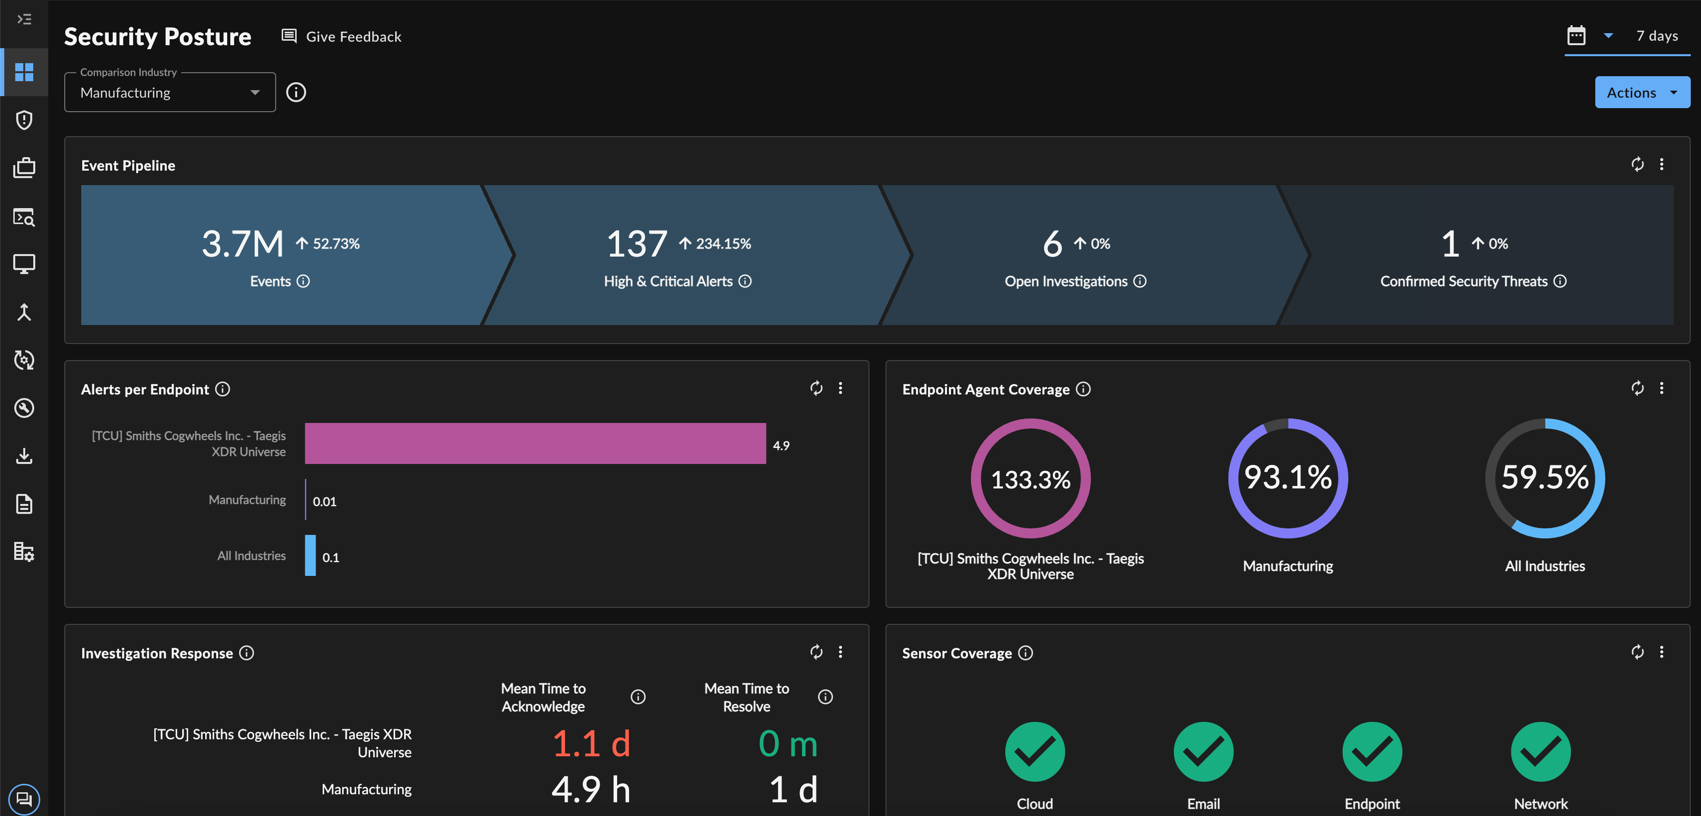
Security Posture Dashboard
Edit Dashboard Settings ⫘
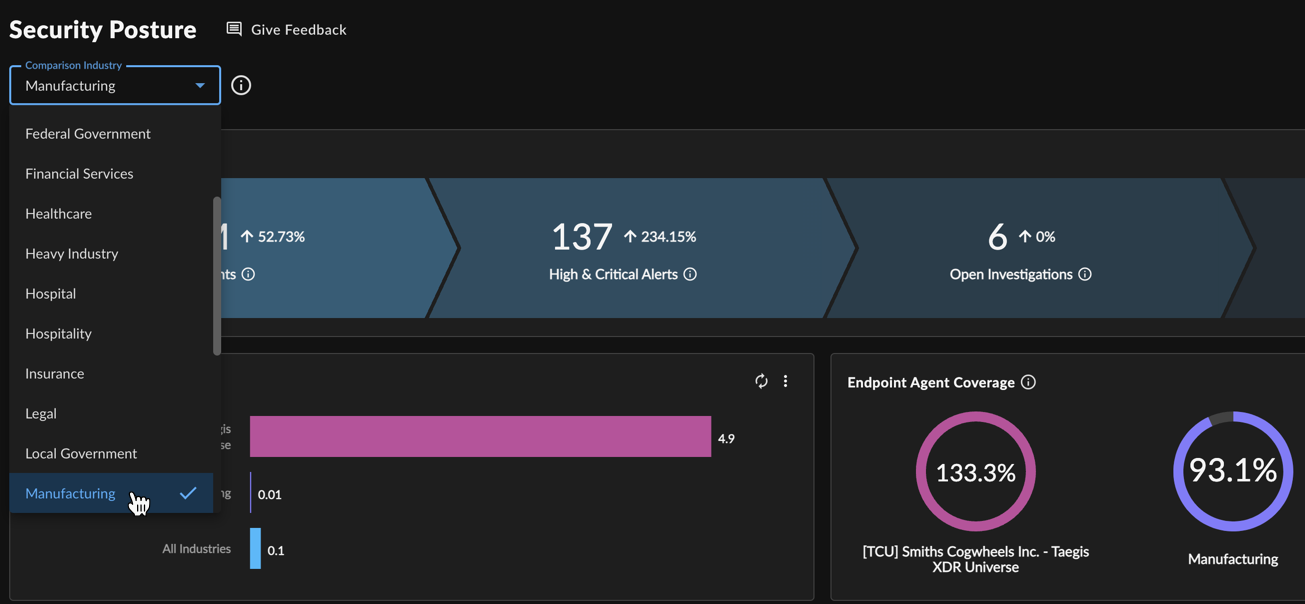
Settings for the Security Posture Dashboard
Date Range ⫘
Change the date range of all widgets at the same time by using the drop-down date range picker at the top right of the dashboard. Choose from Last 7 Days, Last 30 Days, or Last 90 Days. The most recent date range selected becomes the new default.
Comparison Industry ⫘
Certain widgets (Alerts per Endpoint, Endpoint Agent Coverage, Investigation Response, and Confirmed Security Threats) include metrics that compare your organization to Secureworks customers within an industry sector of your choice, as well as to all Secureworks customers within all industries. To select an industry sector, use the Comparison Industry drop-down at the top left of the dashboard.
Affected dashboard widgets are updated automatically as you change the industry.
Note
The industry your organization belongs to is selected by default when you visit the Security Posture Dashboard. Once you make a new choice, it is saved to your local browser session, but it does not affect the industry assigned to your tenant in the backend.
Widgets ⫘
Event Pipeline ⫘

Event Pipeline Widget
The Event Pipeline widget depicts various stages of event filtering for the selected date range (see note below). Refer to this widget as a snapshot of how ingested events are being triaged and handled. The pipeline includes the following metrics:
- Events — The number of raw events received from all sensor types during the selected time period
- High & Critical Alerts — The number of high- and critical-severity alerts that were triggered from those events during the selected time period, excluding suppressed alerts
- Open Investigations — The number of investigations that are currently in an Open state, during the selected time period
- Confirmed Security Threats — The number of investigations that were resolved in the selected time period with a Threat Mitigated or Confirmed Security Incident status
Each metric also includes a percentage, which compares the current date range being viewed to the previous date range. For example, in the screenshot above, 17 investigations in the current range is 83.5% less than the number of investigations in the previous range.
Note
As part of the ingestion statistics, the number of raw events for the previous day is calculated daily starting at 08:00 UTC and is expected to be completed within a reasonable time period. Due to this batch job, the Event Pipeline widget does not include the number of raw events for the current day. If viewed before the batch job at 08:00 UTC, the number of events does not include the previous day either. Therefore, the Event Pipeline widget data is based on a smaller date range than what is selected for the dashboard. For example, when a seven-day range is selected for the dashboard, and the dashboard is viewed at 07:30 UTC, the actual date range for the widget is five days starting two days prior to the current day. The prior range is five days as well so that the comparison between the current and prior ranges makes sense.
To align the date range for all metrics on the Event Pipeline widget, the number of high and critical alerts, open investigations, and confirmed security threats follow the same logic for an accurate and consistent pipeline flow.
Alerts per Endpoint ⫘

Alerts per Endpoint Widget
The Alerts per Endpoint widget is a bar chart displaying the sum of high- and critical-severity alerts divided by the number of active endpoints. Use this widget to gauge the activity in your environment, including how your rulesets are configured. You can compare your organization’s count to your Selected Industry (the Comparison Industry you chose) and All Industries (all customers reporting into XDR).
Note
Data in this widget is only available for the Last 7 Days or the Last 30 Days.
Endpoint Agent Coverage ⫘

Endpoint Agent Coverage Widget
The Endpoint Agent Coverage widget displays the percentage of endpoint agents actively reporting in to XDR relative to the number of contracted licenses you have. Use this metric to determine if all your endpoints are reporting in.
Note
Most environments show one agent per license, but some environments may have more than one agent per device, resulting in an endpoint agent coverage of over 100%.
You can compare your organization’s percentage to your Selected Industry (the Comparison Industry you chose) and All Industries (all customers reporting into Secureworks® Taegis™ XDR). Each industry average is calculated by averaging the ratio between endpoint agents reporting in relative to contracted licenses. A percentage over 100% indicates there is more than one agent per device, such as a Red Cloak™ Endpoint Agent and Carbon Black on each device. The number of endpoint agents in the widget resembles the number on Endpoint Agents, but may not match exactly.
Tip
Customers are strongly encouraged to deploy 100% coverage. For details on how to achieve this in your environment, please contact your designated Customer Success Manager.
Note
Data in this widget is only available for the Last 7 Days or the Last 30 Days.
Investigation Response ⫘

Investigation Response Widget
The Investigation Response widget displays the average time taken to respond to and resolve an investigation. Use this widget to evaluate how efficient your investigation handling is. There are two columns of metrics:
- Mean Time to Acknowledge — The mean amount of time from when an investigation is set to Awaiting Action to when it is viewed by an analyst, for the selected time period
- Mean Time to Resolve — The mean amount of time from when an investigation is set to Awaiting Action to when it is closed, for the selected time period
You can compare your organization’s mean times to your Selected Industry (the Comparison Industry you chose) and All Industries (all customers reporting into XDR).
Tip
Mean times marked in red indicate that your values are longer in duration than your Selected Industry, while mean times marked in green indicate that they are shorter.
Note
Only ManagedXDR subscribers will see their current tenant bar populated in this widget. Non-subscribers will see the value 0.
Sensor Coverage ⫘

Sensor Coverage Widget
The Sensor Coverage widget provides a snapshot of which of your sensors are reporting into XDR successfully, for the selected date range. Use this widget to quickly identify where device health may need review. It is broken down according to four sensor types: Cloud, Email, Endpoint, and Network. For example, in the screenshot above, XDR has not received data from any email sensors in the last 30 days — this may mean that your email sensors need review, or that you don’t have any email sensors set up. For more information on addressing data source issues, see View Data Source Health.
Tip
Refer to Capabilities At a Glance for an overview of the data provided from supported integrations that may provide increased coverage of your environment.
Confirmed Security Threats ⫘

Confirmed Security Threats Widget
The Confirmed Security Threats widget is a line chart displaying the number of investigations that were closed during the selected date range with a Threat Mitigated or Confirmed Security Incident status. You can compare your organization’s count to your Selected Industry (an average for the Comparison Industry you chose) and All Industries (an average for all customers reporting into XDR). Use this widget to surmise if you are experiencing more or fewer security incidents than is typical. Hover over the line chart to view metrics for specific dates on the timeline.
Taegis Countermeasure Updates ⫘

Taegis Countermeasure Updates Widget
The Taegis Countermeasure Updates widget displays a table of all updates to alert detection rules made by the Secureworks Counter Threat Unit™ (CTU) during the selected time period, in order of most recent. The MITRE ATT&CK tactics targeted by the countermeasures are listed in the table; select the name of the detection rule to view additional information, like severity, techniques, and description. Use this widget to stay up to date on our latest efforts to protect your organization from threats.
For more information on CTU operations, see Threat Intelligence Overview.
Export Options ⫘
Export Dashboard to PNG ⫘
To export the entire dashboard to a PNG image file, select Actions from the top right of the dashboard and choose Download as PNG. The file automatically downloads.
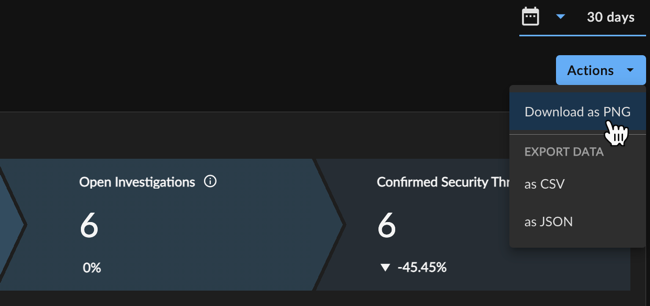
Export Dashboard to PNG
Export Dashboard Data ⫘
To export all data from the dashboard to a CSV or JSON file, select Actions from the top right of the dashboard and choose the Export Data CSV or JSON option.
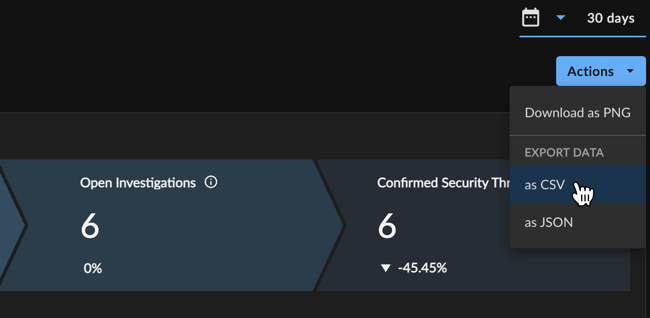
Export Dashboard Data
Export Widgets to PNG ⫘
To export an individual widget to a PNG image file, select the vertical ellipsis from the top right of the desired widget and choose Download as PNG. The file automatically downloads.

Export Widget to PNG
Export Widget Data ⫘
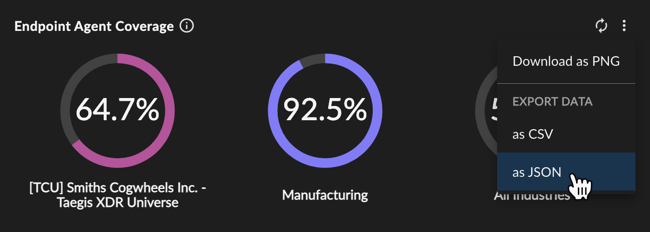
To export widget data as a CSV or JSON file, select the vertical ellipsis from the top right of the desired widget and choose the Export Data CSV or JSON option.
Export Widget Data
